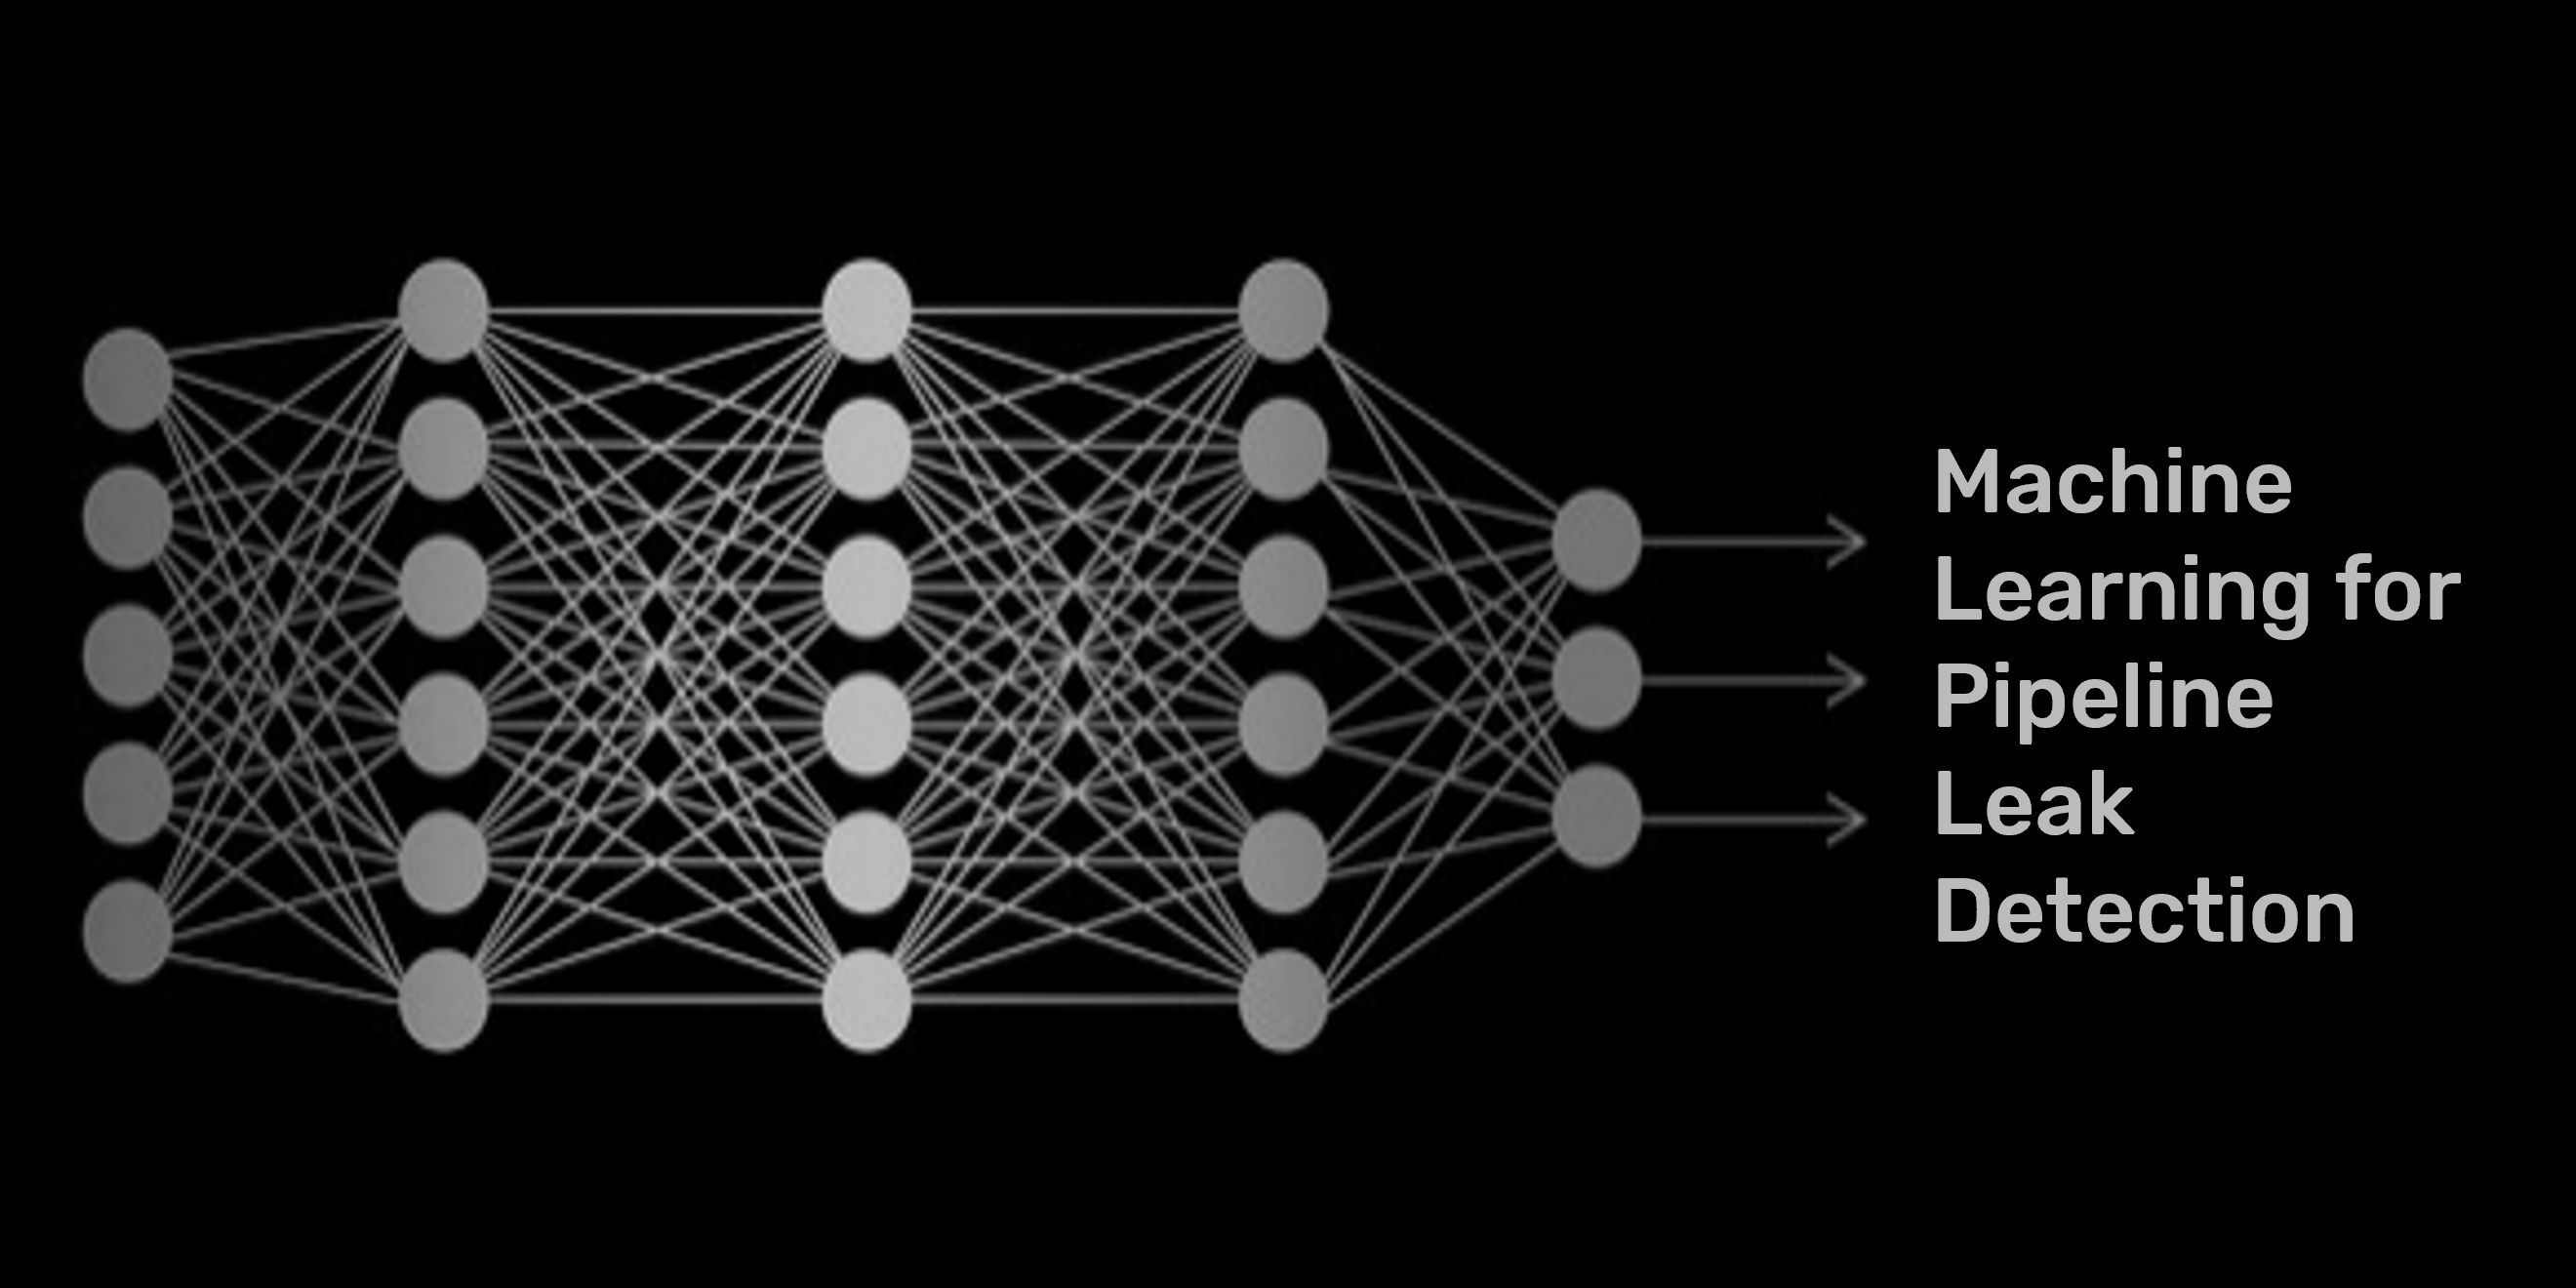
The following article is the second of a two-part series discussing machine learning and how we at Flowstate are using it to tackle leak detection in hazardous liquid pipelines. The first part discussed some common questions that arise when discussing the application of machine learning in pipeline leak detection, such as how it is used, how easy it is to use, and what benefits it provides. We also briefly mentioned the different kinds of machine learning and promised to dig in a little deeper on that and how Flowstate is using Machine Learning in a follow-up article. So as promised…
Different flavors of machine learning
Again, as mentioned in our previous article, there are different methods of machine learning. These different methods have different utilities depending on the data you have and the problem you are trying to solve. The following will briefly describe some methods and note which of them we are using in our leak detection solution.
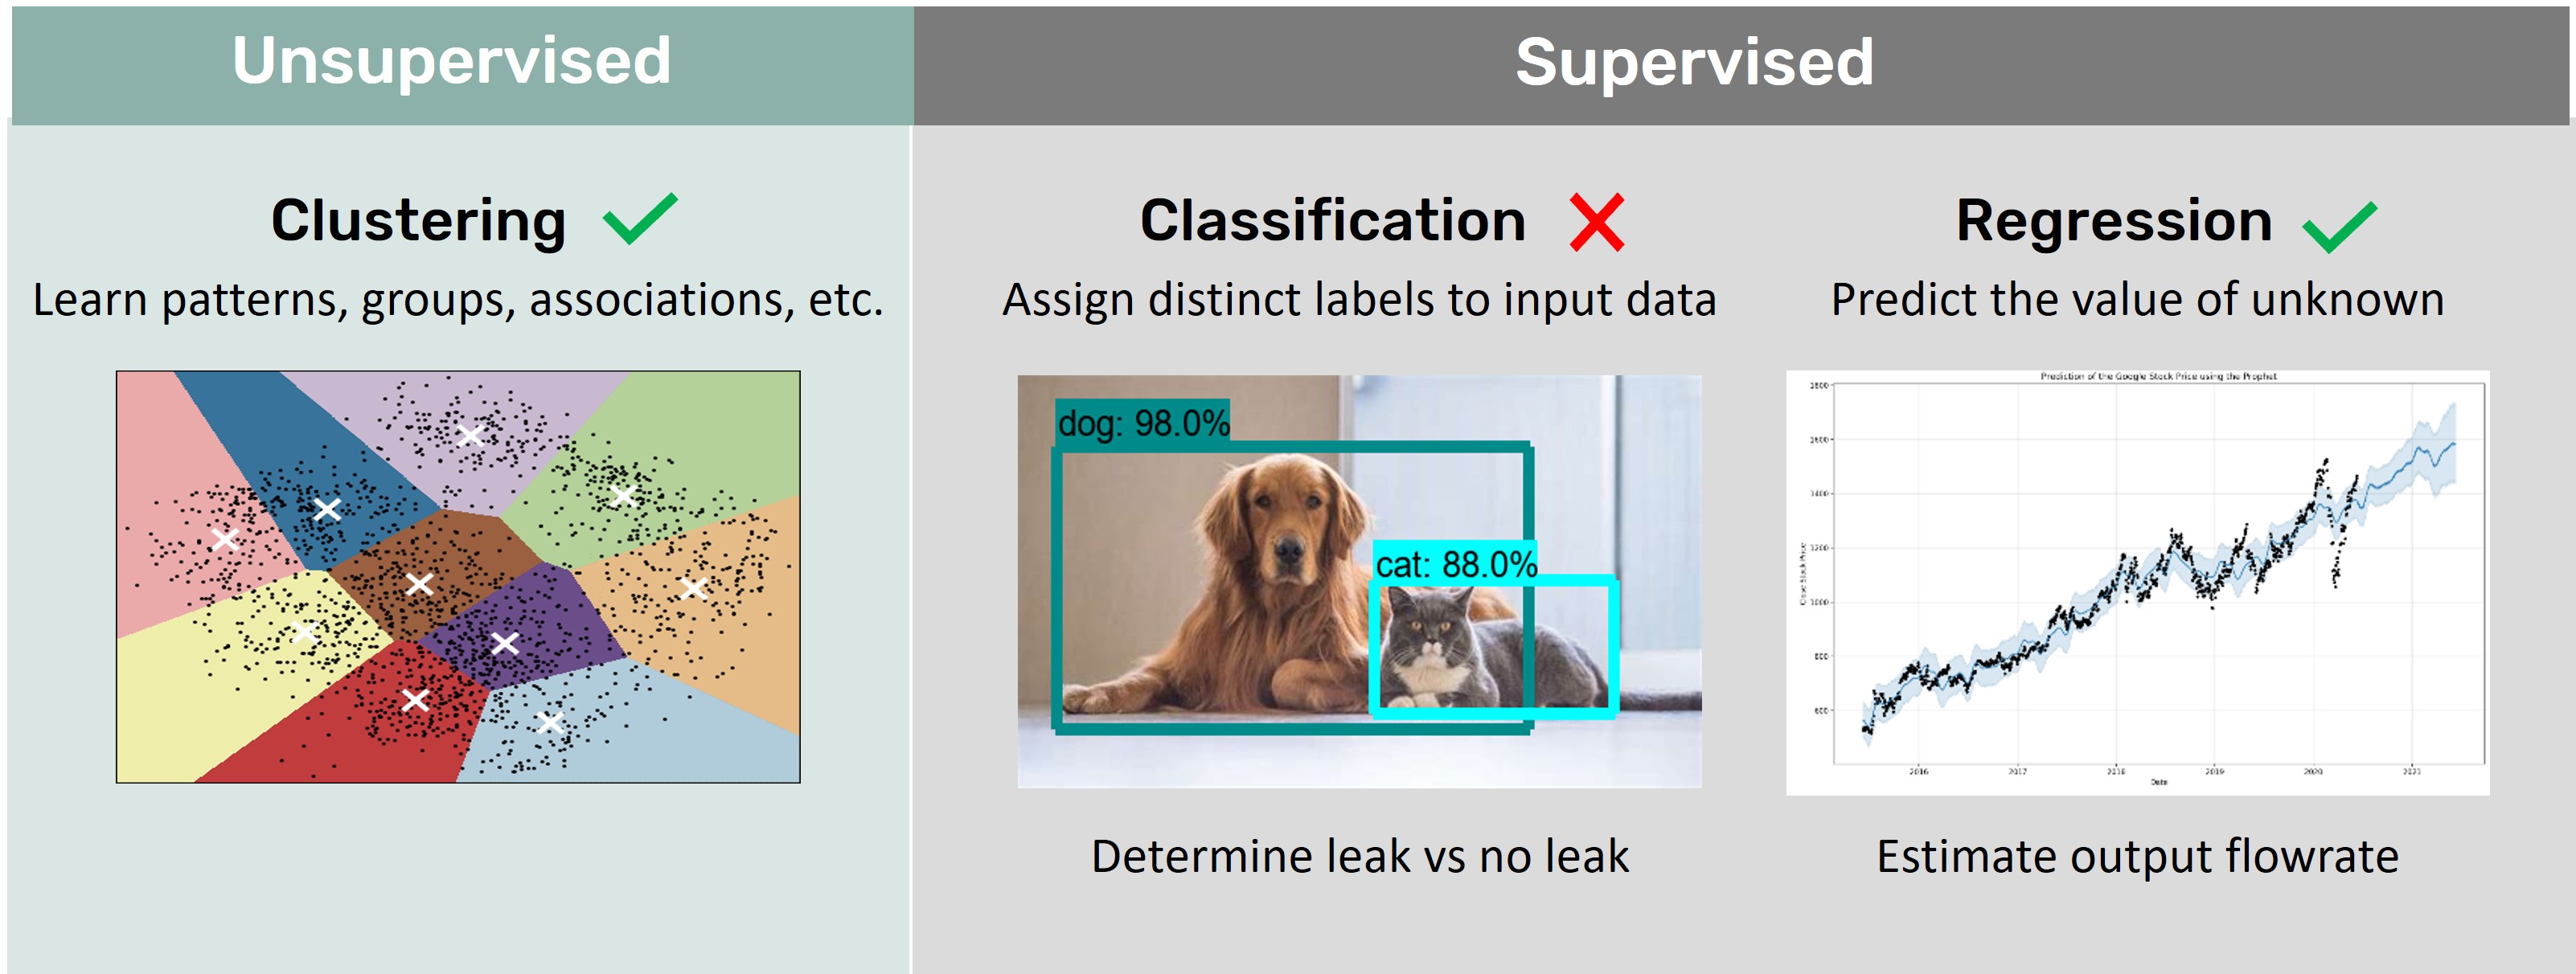
To begin, these methods are categorized into two classes: Unsupervised and Supervised learning.
Unsupervised learning is essentially trying to find patterns or groups within your data without having to know anything about your data. A common form of this is Clustering where machine learning is used to identify natural groups or clusters in the features of the data. This is something we apply at Flowstate in our process of developing a model for a particular segment. Clustering helps us to group different operational regimes - such as low pressure periods - so we can do more in depth analysis and characterization without having to explicitly define rules or spend a lot of time and resources evaluating the data.
Supervised learning can broadly be broken down into Classification and Regression, illustrated in the example above. Classification is the process of assigning a label to input data – such as “dog” or “cat” in the example above. In the context of leak detection, Classification might look like: Given some sensor readings from the pipeline, do the conditions represent a leak or normal operations? This is not how we apply machine learning at Flowstate. Classification models require a lot of data to train and perform well. We are fortunate that there are not that many pipeline leaks – certainly not enough to train a machine learning model on.
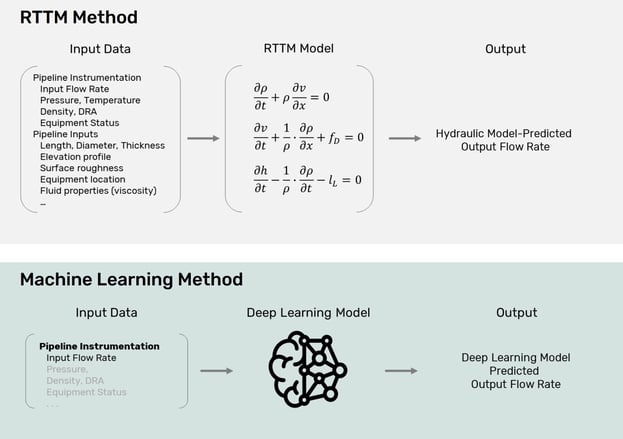
Instead, we are using a second type of supervised learning called Regression. It allows you to predict or estimate a desired output value given some input. Some common uses of Regression modeling include predicting house prices based on inputs such as features, location, etc., or forecasting weather based on various inputs. In our case we train a model on weeks or months of a pipeline’s data. We then build a regression model to estimate the output flowrate of the pipeline given various input readings (flowrate, pressure, pump status, etc.). We are using this regression model in much the same way a detailed hydraulic model - or real-time transient model (RTTM) - is used. With a real-time transient model, equations for fluid flow are used to calculate the expected output flow.
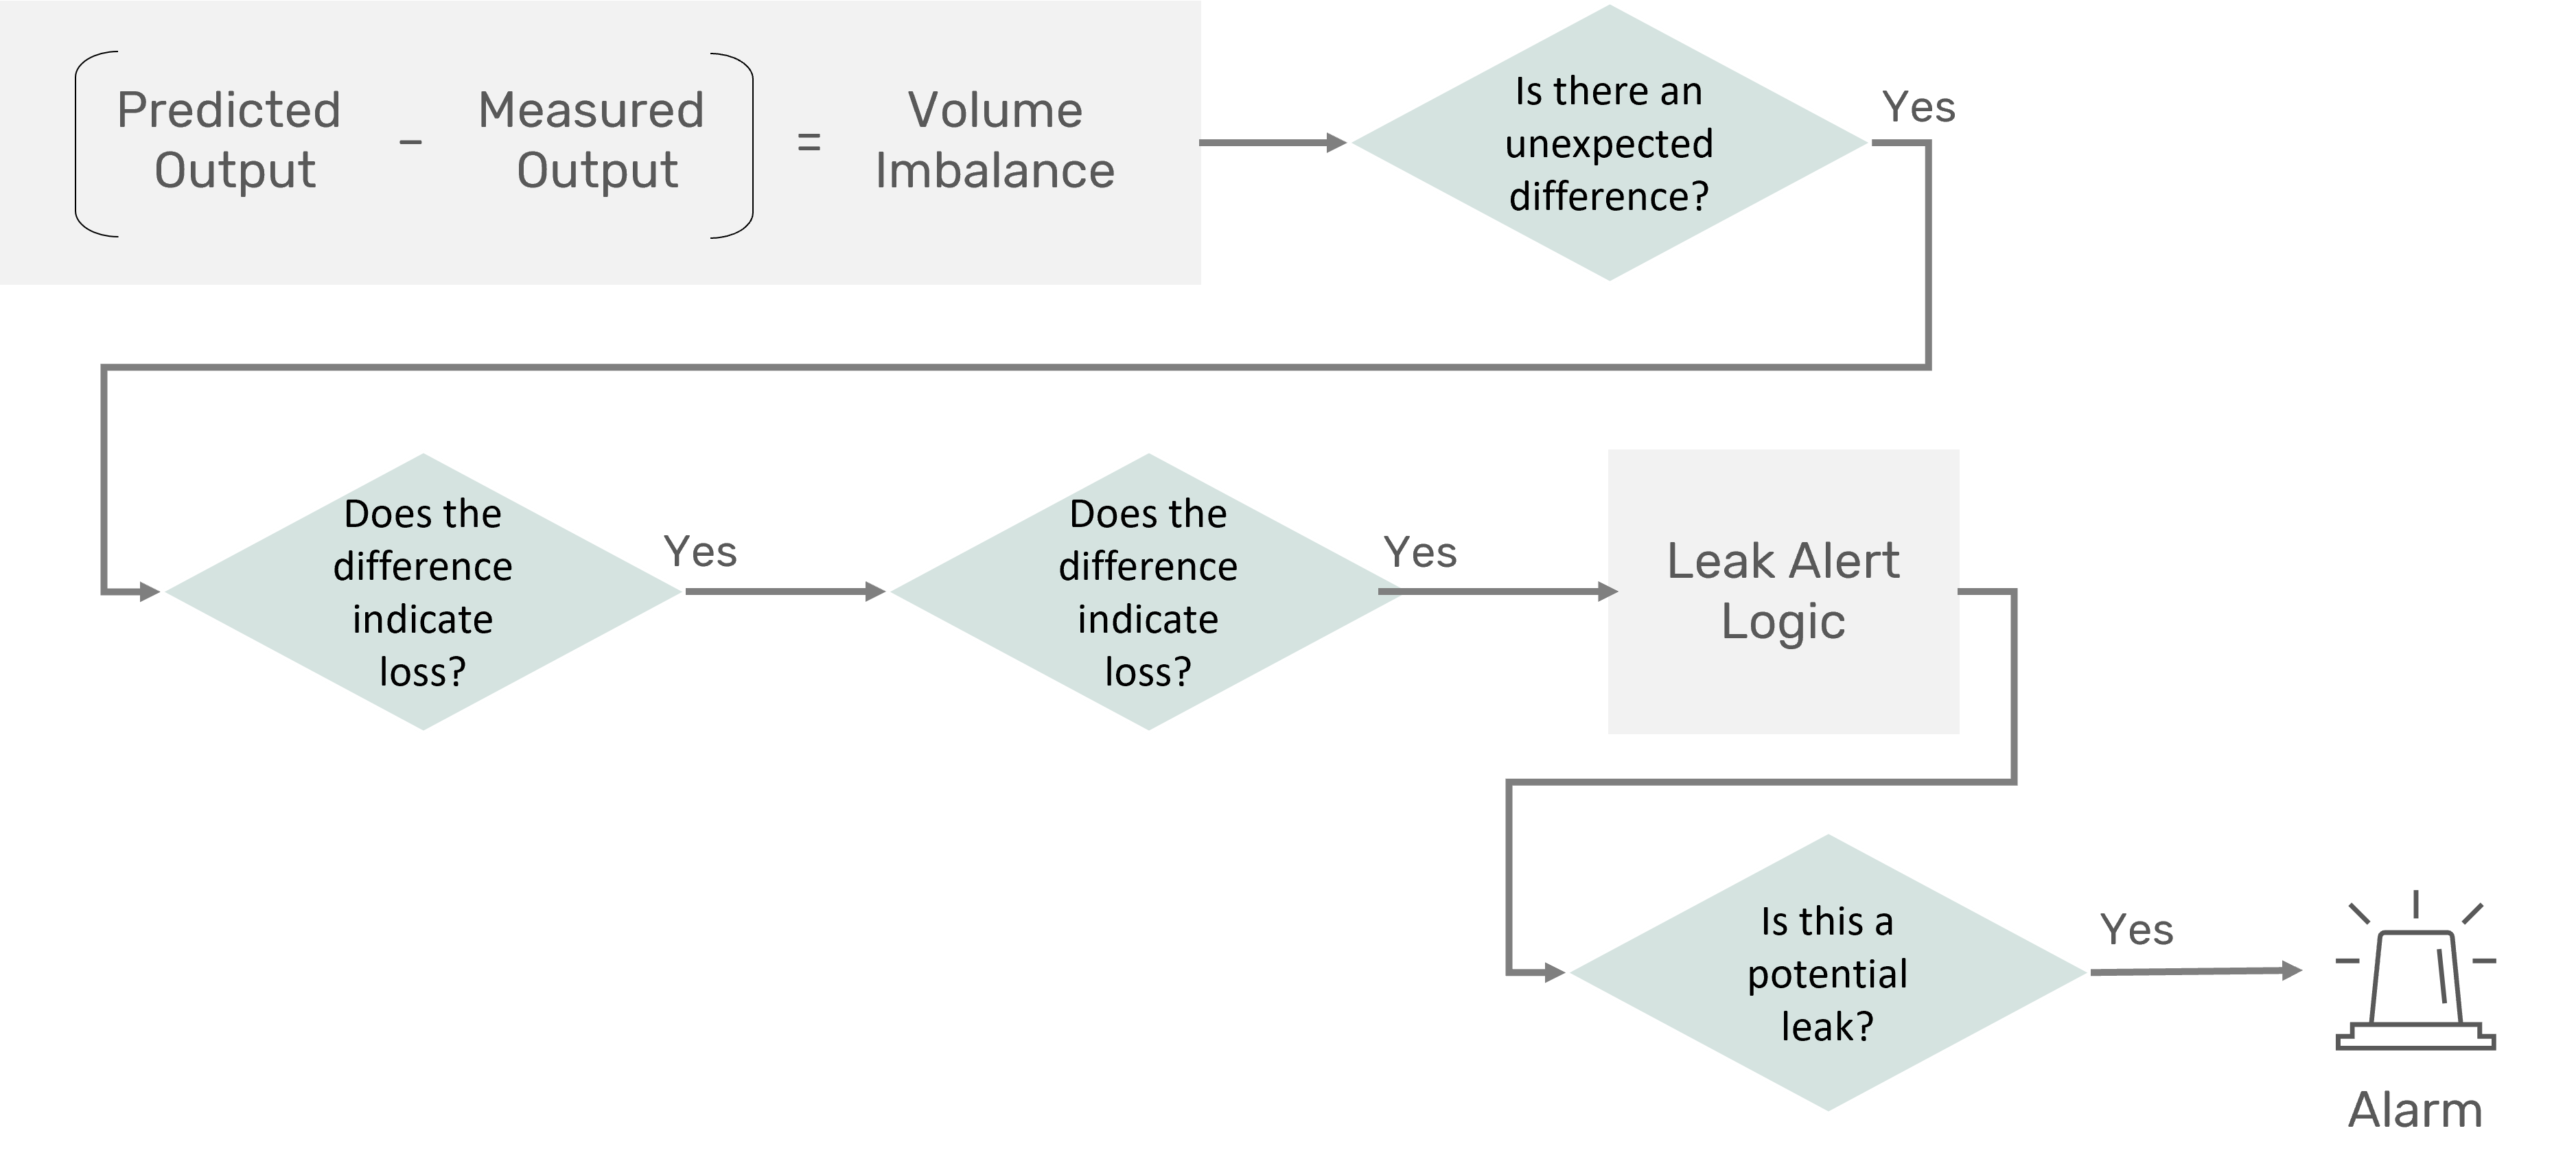
Just as with a hydraulic model, we can then compare that predicted (calculated or forecasted) output to the real-time measured output. Any discrepancy – or volume imbalance – is evaluated with auxiliary methods to determine if it is a leak. For example, we use our imbalance in a variety of standard leak detection methods such as statistical volume balance and leak signature monitoring.
It is key to note that we are not using the machine learning to determine explicitly if there is a leak. Rather, it is providing input to an alert algorithm that includes additional logic to help determine if there may be a leak.
So how well does Deep Learning perform?
The following shows an example of results for a segment with several changes in flow rate over a 4-hour stretch. The top graph shows the output flow predicted by the machine learning model (blue) and the flow measured by the output flow meter (orange).
The bottom graph shows the resulting imbalance. The “DL Imbalance” (DL for deep learning) in orange shows the difference between the model-predicted output and the measured output shown in the top graph. Presumably, there is not a leak on the line during this window, so the predicted output and the actual measured output – the imbalance – should be zero. It can be seen that the DL Imbalance does a good job of staying near zero even during changes in flow rate where large imbalance disruptions can happen.
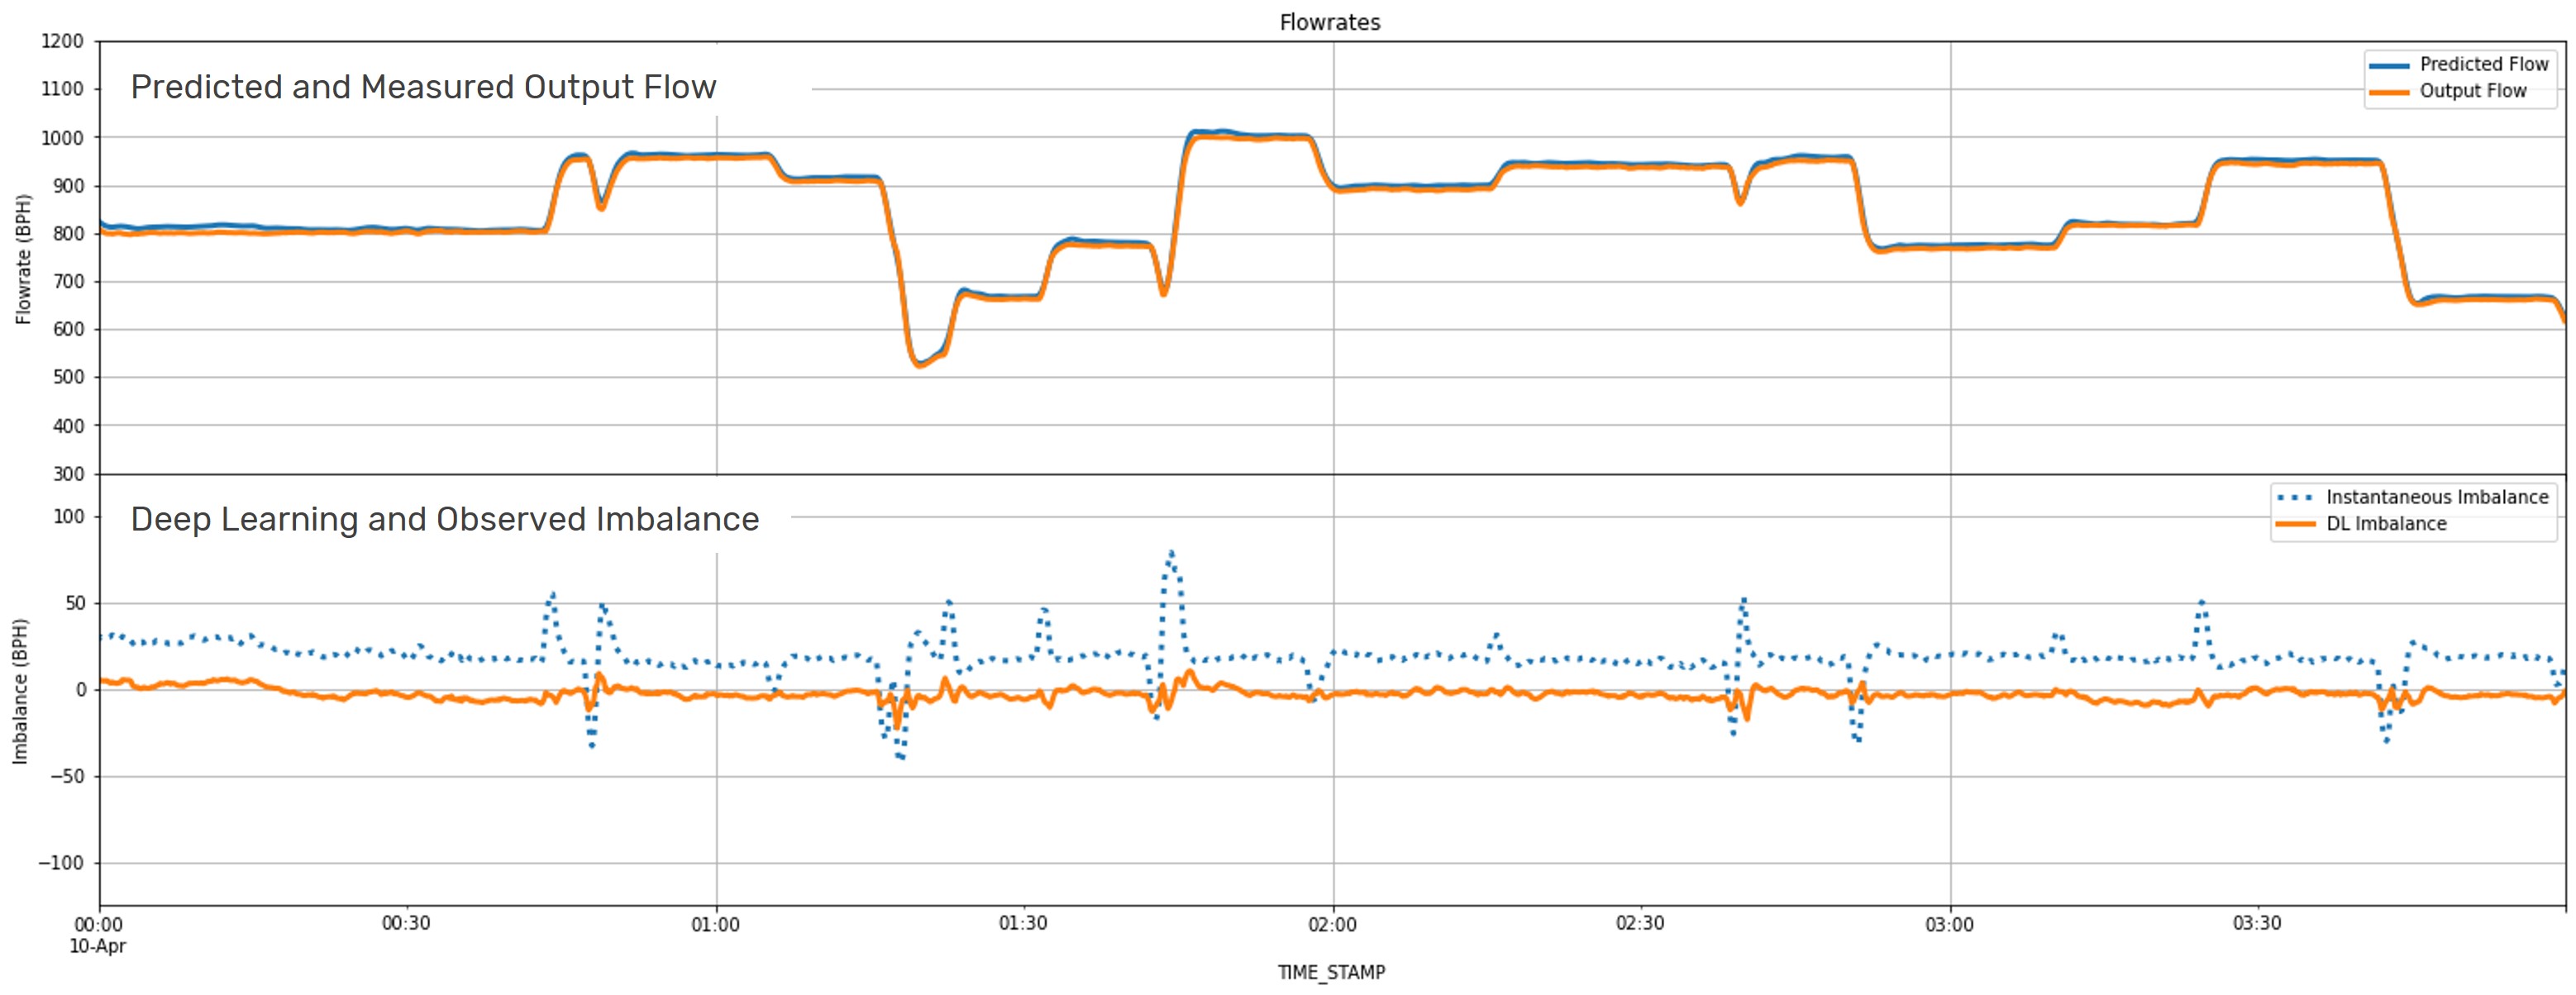
So, why not just take the difference between all inputs minus all outputs and look for discrepancies to indicate a commodity loss (i.e., a simple line balance)? The need for a prediction model is illustrated in the bottom graph.
The need for predicting what the output should be rather than what it is measured to be is illustrated by the dotted line. Referred to in the plot as the “Instantaneous Imbalance”, the dotted line shows the simple difference between input and output flow rates. It can be seen that each time the flow rate changes, there are large swings or disturbances to the resulting imbalance. This is because for several minutes at the change, there is more commodity coming in than coming out – or vice versa. This has an adverse effect on leak detection because alarm thresholds must be set at volumes and durations that prevent false alarms in these instances. If your calculated loss experiences these large disturbances during transients, you must set alarm thresholds high enough to avoid alarming during them.
In other words, a better estimate of imbalance allows for tighter alarm thresholds – which means better leak detection sensitivity.
Advantages of Machine Learning
There are some key advantages in using a machine learning-based approach instead of a detailed hydraulic model.
Less Data Requirements - First, machine learning requires far fewer inputs. As mentioned earlier, building an accurate hydraulic model of flow through a pipeline requires a lot of data about the physical characteristics of the pipeline and the fluid flowing within. For some pipelines, instrumentation may be limited, and this data is simply not available. In other cases, it may not have the precision and accuracy required for detailed modeling. The machine learning algorithm is able to learn to the behavior of the system with very few inputs. In fact, we have built successful models using only flow rate. Machine learning is able to handle noisy meters as well.
Less Labor Intensive - Secondly, real life doesn’t fit easily into fluid flow equations. With all those inputs required for hydraulic modeling comes a lot of time tweaking and tuning to build a model that can closely approximate reality. This can amount to months of engineering. In contrast, with weeks of operational data available, a deep learning model can be built and tested in less than a week – sometimes less than a day.
Up to the Challenges - Machine learning can also handle several of the challenges posed by a operational pipeline system, including complex configurations, meter offsets, packing and unpacking, varied flow rates, changing commodities, and more.

DOWNLOAD THE EBOOK
If you would like to read more about our use of machine learning and see some example results, I invite you do download our ebook which goes into more detail!
Comments
Add Comment